Company Sales Analysis
DIAGO is a well-known liquor company. They are actively seeking to optimize the distribution of their products in various cities while aiming to reduce inventory costs and the expenses associated with shortages (opportunity cost) in order to foster their growth. To accomplish this, they possess a dataset in .csv format, which contains approximately 20 million records detailing the sales history of liquor over the past 8 years, organized by country, city, and establishments.
In this project, a dataset will be analyzed and loaded into a Cloud-based database. Subsequently, a thorough data analysis will be performed, and an optimized distribution strategy will be developed to maximize profits. The strategy will focus on identifying the most popular products in different areas, allowing DIAGO to efficiently distribute merchandise to high-traffic locations during specific periods. This approach aims to reduce storage and distribution costs for DIAGO.
The project aims to optimize DIAGO's liquor distribution strategy using an extensive eight-year sales dataset of approximately 20 million records. Through rigorous data analysis and leveraging tools like Pandas, Dask, and visualization libraries like Plotly and Folium, the project identifies sales trends, popular products across regions, and proposes an optimized distribution strategy to reduce inventory costs, minimize shortages, and maximize profits. Key findings emphasize the limitations of LSTM for long-term predictions, advocating for alternative models, while highlighting the efficiency of Pandas and Dask for handling different dataset sizes. The project's recommendations seek to provide actionable insights for DIAGO to enhance its competitive edge in the liquor market.
Problem
DIAGO, a prominent liquor company, faces challenges in optimizing their product distribution across various cities. The primary issues include inflated inventory costs, expenses linked to shortages, and inefficient distribution, impacting the company's growth potential. The lack of a refined strategy tailored to regional preferences and sales patterns leads to suboptimal allocation of merchandise, resulting in higher costs and missed revenue opportunities.
Solution
DIAGO, a prominent liquor company, faces challenges in optimizing their product distribution across various cities. The primary issues include inflated inventory costs, expenses linked to shortages, and inefficient distribution, impacting the company's growth potential. The lack of a refined strategy tailored to regional preferences and sales patterns leads to suboptimal allocation of merchandise, resulting in higher costs and missed revenue opportunities.
Conclusions
The Forecast model works well for predictions close to the date; the more data you request it to predict, the model tends to draw a trend rather than a prediction.
When dealing with large datasets, data manipulation is more efficient with the Dask library. Pandas is more suitable for small and medium-sized datasets that fit in memory, while Dask is designed to handle larger datasets as this library allows data manipulation in a distributed computing environment.
The forecast results demonstrate that LSTM is not the best model for a one-year prediction, and other models that may better fit the data should be evaluated.
LSTM works better for predictions immediately after real values, so a series of short-term predictions should be made into the future.
Plotly is an excellent and easy-to-use tool for visualizing forecast results, allowing control over axes, titles, and element colors.
Dask is a very useful tool for handling large amounts of data; however, when reducing the amount of data through processing, Pandas can be used for more complex operations and model usage.
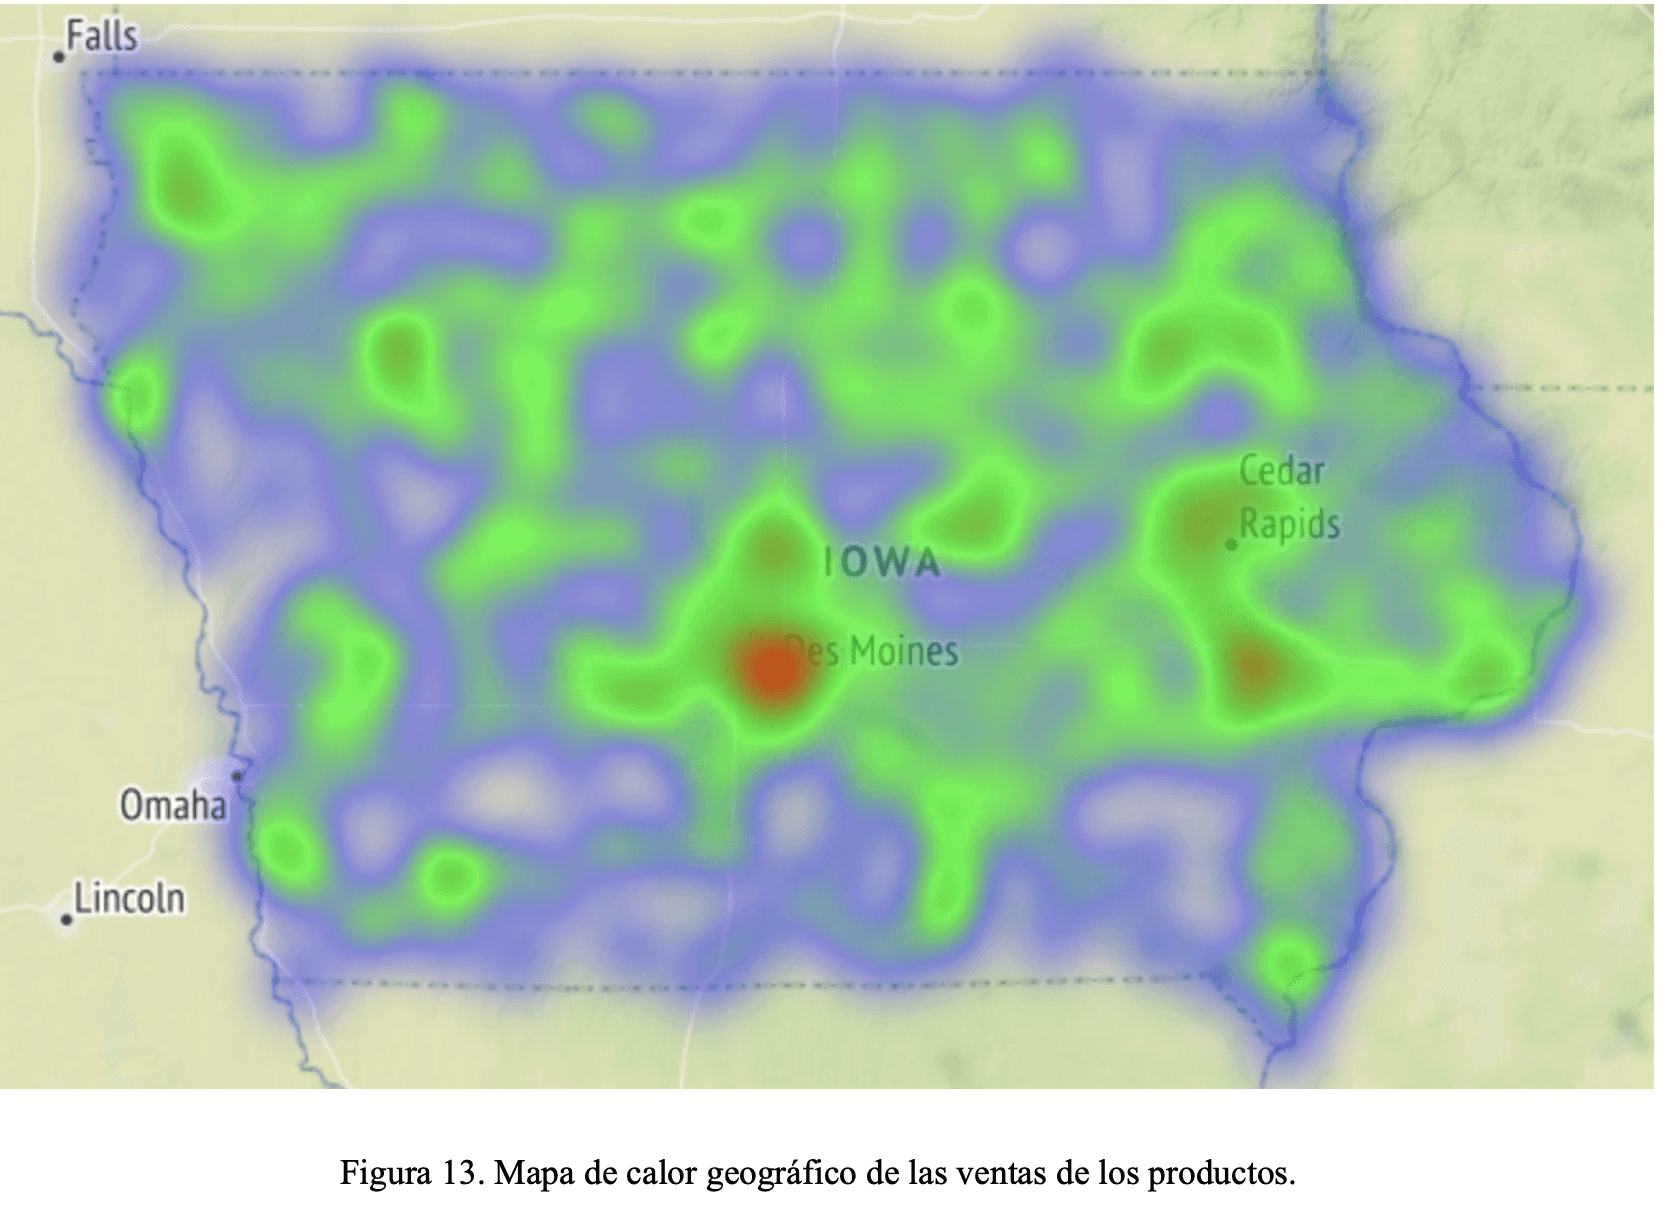
The analysis of liquor sales database, combined with geographical visualization through a heat map, has provided valuable information about the spatial distribution of sales. The graphical representation allowed the identification of areas with high sales levels and the geographical positions of establishments with high commercial activity.
Folium in Python has proven to be a powerful and versatile tool for geospatial data visualization. This library offers a wide range of functionalities that allow the easy creation of interactive and customized maps.
© Nicolay Agustin. 2023